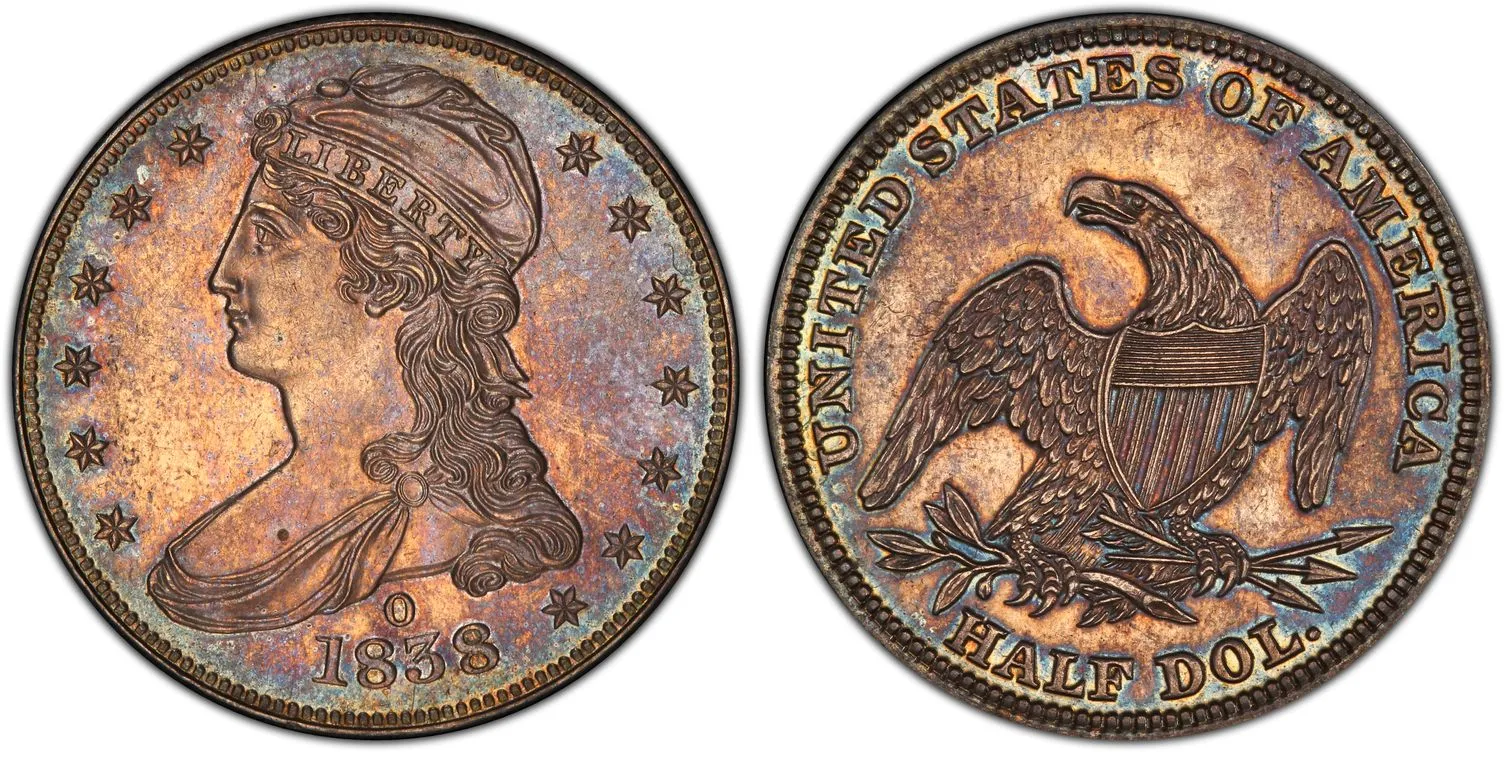
As of May, 2024, a 1838-O Half Dollar, BM in circulated condition is worth between $350,000.00 and $450,000.00, while an uncirculated specimen can be valued between $650,000.00 and $800,000.00, depending on its grade and strike quality.
Looking back at auction records, the highest price was achieved by a Mint State grade that was hammered at $763,750.00 in the 01/08/2014 by renowned auctioneer Heritage Auctions, showcasing the allure of top-tier rarities.
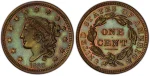
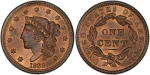
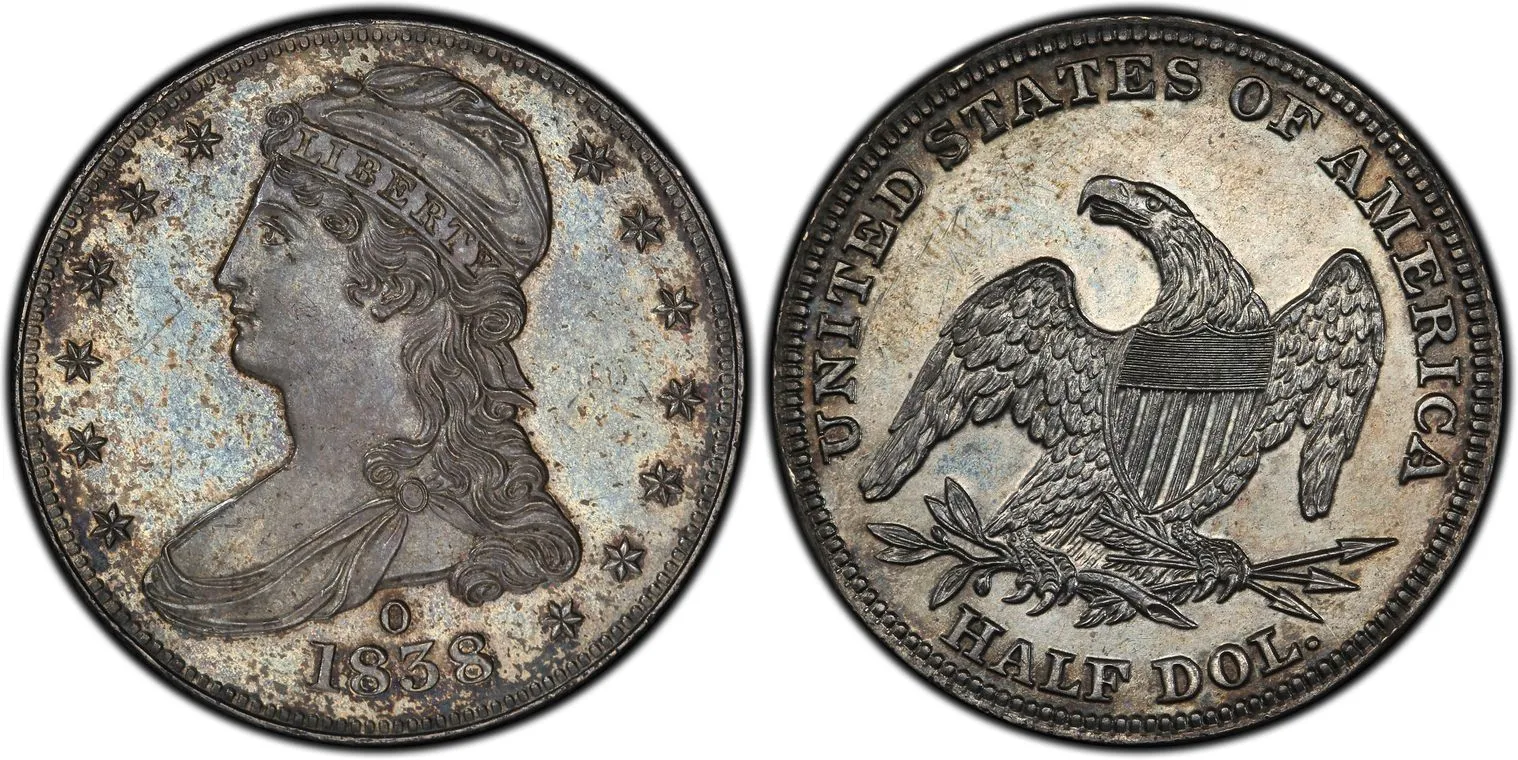
1838-O Half Dollar, Bm (Proof) – Price Chart
If you are aware of your coin’s grade, refer to the following chart to determine its value:
| Grade | Price($) |
|---|---|
| MS-64 | 800,000.00 |
| MS-63+ | 700,000.00 |
| MS-63 | 650,000.00 |
| AU-50 | 450,000.00 |
| XF-45+ | 375,000.00 |
| XF-45 | 350,000.00 |
If you are unsure of the grade, you can assess it based on the coin’s condition. More detailed information here.
| Grade | Lowest Price($) | Highest Price($) | Average Price($) |
|---|---|---|---|
| Mint State | 650,000.00 | 800,000.00 | 716,666.67 |
| About Uncirculated | 450,000.00 | 450,000.00 | 450,000.00 |
| Extremely Fine | 350,000.00 | 375,000.00 | 362,500.00 |
Please note that the estimated values are derived from the latest data in the PCGS Price Guide and are not guaranteed to be 100% accurate. We strongly recommend reviewing actual auction records, which can be filtered by grade. For further insights, refer to our analysis report, which is based on these data.
Also, there are multiple versions of the 1838 Capped Bust Half Dollar. We recommend checking the values of these coins as well to ensure a comprehensive assessment.
| Coin Name | Min Circulated Price($) | Max Circulated Price($) | Min Uncirculated Price($) | Max Uncirculated Price($) |
|---|---|---|---|---|
| 1838 Half Dollar (Proof) | N/A | N/A | 200,000.00 | 500,000.00 |
| 1838 Half Dollar (Regular Strike) | 60.00 | 1,350.00 | 1,500.00 | 135,000.00 |
Coins listed have various mint marks and designations indicating where they were minted and if they are special strikes. To learn more about what the different mint marks and designations mean, please refer to our Mint Mark Chart and Coin Designation Reference Chart.
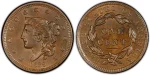
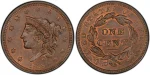
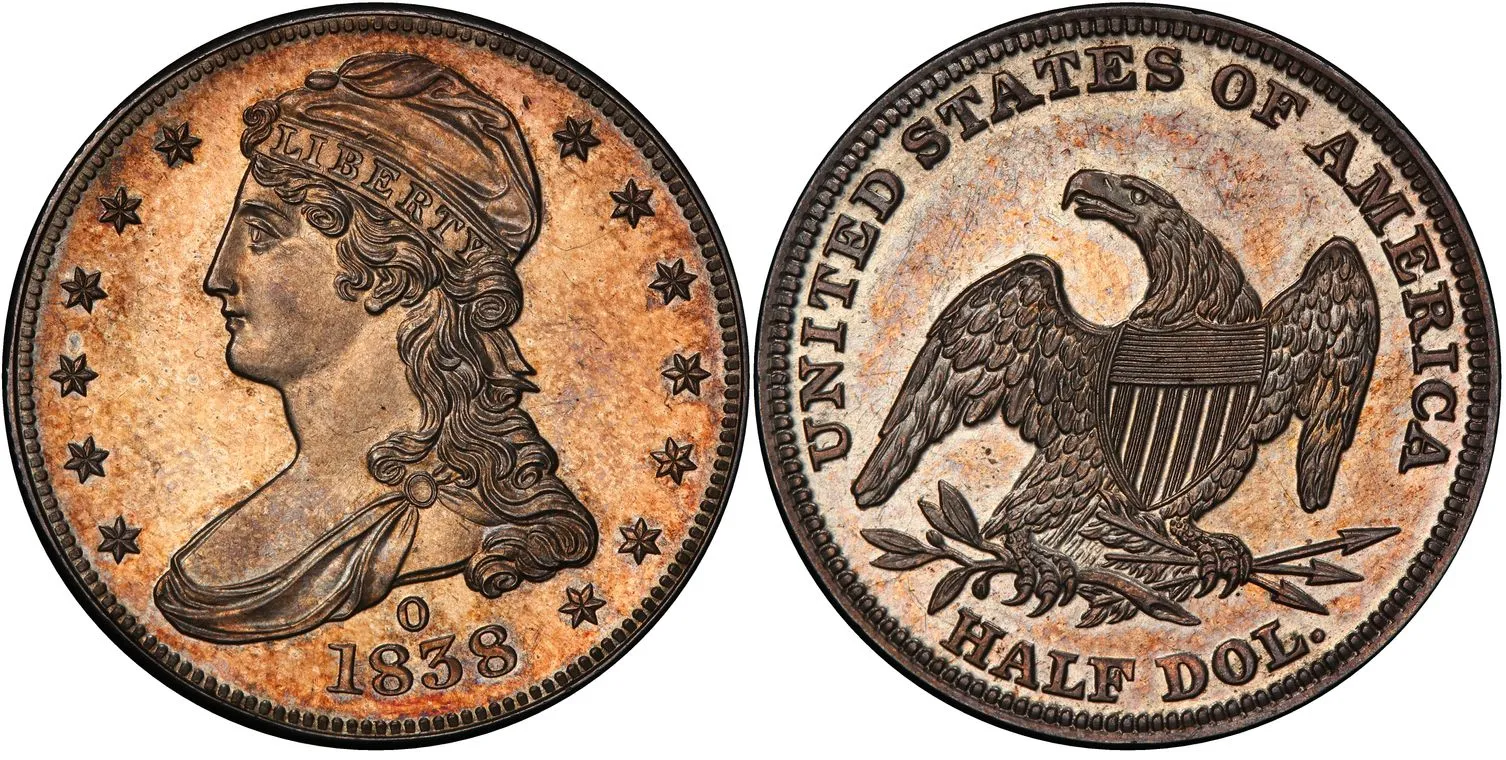
1838-O Half Dollar, Bm (Proof) – Auction Chart & Report
This tool is very user-friendly. Simply select the coin grade, and our system will provide detailed information including:
- Lowest Sale Price
- Highest Sale Price
- Average Sale Price
- Most Recent Sale Price
- Number of Sales
- Sales Volume
You can also select different time periods for your query: 1 month, 6 months, 1 year, 3 years, or All time, with the default set to All time.
Grade Impact Analysis
| Grade | Lowest Price($) | Highest Price($) | Average Price($) |
|---|---|---|---|
| MS-65 | 211,500.00 | 211,500.00 | 211,500.00 |
| MS-64 | 93,500.00 | 763,750.00 | 560,645.83 |
| MS-63 | 104,500.00 | 632,500.00 | 421,250.00 |
| MS-60 | 121,000.00 | 121,000.00 | 121,000.00 |
| AU-50 | 184,000.00 | 293,750.00 | 251,250.00 |
| XF-40 | 253,000.00 | 253,000.00 | 253,000.00 |
| VF-35 | 1,600.00 | 1,600.00 | 1,600.00 |
The chart shows the min and max prices for the 1838-O Half Dollar, BM (Proof) coin across various grades from VF-35 to MS-65. The prices generally increase as the grade improves, with MS-64 having the highest max price $763,750.00.
Within each grade, there is also variability in prices, likely due to factors like specific coin characteristics or market conditions at time of sale. Overall, the chart illustrates how coin grade is a key driver of value for this particular 1838-O Half Dollar, BM (Proof).
Auction House Comparison
The pie chart breaks down the market share of various auction houses for selling the 1838-O Half Dollar, BM (Proof) coin. Heritage Auctions dominates with 52.94% share, followed by Bowers & Merena / Stack's Bowers with 17.65% / 11.76% appearances respectively..
Price Trend Over Time
The graph presents a detailed analysis of the average annual auction sale price and frequency for the 1838-O Half Dollar, BM (Proof) coin over the years. This visual representation traces the coin's value fluctuations, illustrating periods of increase, decrease, or stability in its average auction price.
Such a historical view is indispensable for collectors, investors, or researchers who are keen on comprehending the market dynamics and the coin's value trend over an extended period.
Raw Auction Records
Here are the lasted auction records from the auction history of the past years. You can filter these records by coin grade.
| Grade | Grade Source | Seller | Price($) | Sold Date |
|---|---|---|---|---|
| MS-63 | PCGS | Stack's Bowers | 504,000.00 | 11/20/2019 |
| MS-63 | PCGS | Heritage Auctions | 444,000.00 | 01/03/2018 |
| MS-65 | NGC | Heritage Auctions | 211,500.00 | 01/04/2017 |
| MS-64 | PCGS | Stack's Bowers | 493,500.00 | 05/24/2016 |
| AU-50 | PCGS | Heritage Auctions | 293,750.00 | 08/16/2015 |
| MS-64 | NGC | Heritage Auctions | 646,250.00 | 05/12/2015 |
| MS-64 | NGC | Heritage Auctions | 763,750.00 | 01/08/2014 |
| MS-64 | PCGS | Heritage Auctions | 734,375.00 | 01/09/2013 |
| AU-50 | PCGS | Heritage Auctions | 276,000.00 | 04/01/2008 |
| MS-63 | PCGS | Heritage Auctions | 632,500.00 | 02/13/2008 |
| XF-40 | NONE | Stack's | 253,000.00 | 10/01/2006 |
| MS-64 | PCGS | Heritage Auctions | 632,500.00 | 06/02/2005 |
| AU-50 | NONE | Stack's | 184,000.00 | 10/01/2002 |
| MS-60 | NONE | Bowers & Merena | 121,000.00 | 04/01/1997 |
| MS-63 | PCGS | Bowers & Merena | 104,500.00 | 01/25/1996 |
| MS-64 | NONE | Bowers & Merena | 93,500.00 | 11/01/1988 |
| VF-35 | NONE | Numismatic Gallery | 1,600.00 | 04/01/1941 |